Whether you are a casual sports fan placing an occasional weekend wager or an experienced bettor refining a statistical model, getting the best available price on your wagers is fundamental to long-term success. Many bettors spend hours analyzing team statistics, injury reports, and weather conditions, yet they place their wagers on the first sportsbook app they open. This oversight costs money over time. Learning how to compare betting odds across multiple bookmakers—a process often referred to as line shopping—is one of the simplest and most effective habits you can build to improve your overall returns.
In sports betting, odds represent two core elements: the implied probability of an event occurring and the financial return you receive if your wager wins. Because different sportsbooks operate independently, assess risk differently, and adjust lines based on their own customer order flow, odds for the exact same event frequently vary across platforms. Over dozens or hundreds of bets, even fractional differences in odds compound into significant financial sums. This comprehensive guide walks through why odds differ, how to calculate value, step-by-step methods for comparing prices, and the tools you can use to streamline your workflow.
Why Comparing Betting Odds is Essential for Long-Term Value
To understand why comparing prices matters, it helps to view sports betting through the lens of retail purchasing. If two neighboring stores sell the exact same item, buying it from the store charging a higher price makes little sense. In sports betting, the product is an outcome—such as a specific team winning a match—and the odds represent the purchase price.
Bookmakers do not offer pure probability; they build a profit margin into their pricing, known as the margin, vigorish (vig), or overround. This margin ensures that, across all potential outcomes of an event, the combined implied probabilities exceed 100%. The higher the bookmaker’s margin, the lower the payout returned to the bettor.
The Compound Effect of Price Differences
Consider a straightforward example involving a standard two-way point spread or moneyline bet:
- Bookmaker A offers a team at American odds of -110 (Decimal 1.91).
- Bookmaker B offers the same team at American odds of -105 (Decimal 1.95).
A $100 wager on Bookmaker A yields a profit of $90.91, while the same $100 wager on Bookmaker B yields a profit of $95.24. That $4.33 difference on a single $100 wager represents a 4.76% boost in return for zero additional risk.
If you place 100 similar wagers over the course of a season, that price variance translates to several hundred dollars in difference to your bankroll. Over a betting career, taking -105 instead of -110 can be the exact margin that separates a losing bettor from a profitable one.
Market access also plays a major role in how effectively you can shop for lines. Regulations vary substantially across regions, which directly influences how many operators compete for your business. For instance, bettors looking to explore licensed operators across North America frequently consult comprehensive resources like USA Legal Betting to verify regional sports betting laws, licensing standards, and available operators in their jurisdiction.
Understanding Odds Formats and Implied Probability
Before you can compare prices effectively, you must be completely comfortable reading and converting the three main odds formats used globally: Decimal, Fractional, and American. Comparing odds from different sportsbooks becomes tricky if one operator displays prices in decimal form while another defaults to American odds.
ODDS CONVERSION & IMPLIED PROBABILITY CHEAT SHEET
┌──────────────────┬──────────────┬────────────────┬─────────────────────┐
│ Decimal Odds │ American Odds│ Fractional Odds│ Implied Probability │
├──────────────────┼──────────────┼────────────────┼─────────────────────┤
│ 1.50 │ -200 │ 1/2 │ 66.67% │
│ 1.80 │ -125 │ 4/5 │ 55.56% │
│ 2.00 │ +100 │ 1/1 │ 50.00% │
│ 2.50 │ +150 │ 3/2 │ 40.00% │
│ 3.00 │ +200 │ 2/1 │ 33.33% │
└──────────────────┴──────────────┴────────────────┴─────────────────────┘
1. Decimal Odds (European Format)
Decimal odds display the total payout returned on a successful wager per unit staked, including your original stake.
- Formula: $\text{Total Return} = \text{Stake} \times \text{Decimal Odds}$
- Example: A $10 wager at odds of 2.50 returns $25 total ($15 profit + $10 stake).
- Why it’s best for comparison: Decimal odds are numerically linear. Higher numbers always mean better payouts, making them the easiest format to compare at a glance.
2. Fractional Odds (British / Irish Format)
Fractional odds represent the potential net profit relative to your stake.
- Formula: $\text{Profit} = \text{Stake} \times (\text{Numerator} / \text{Denominator})$
- Example: A $10 wager at 6/4 yields $15 profit ($10 $\times$ 1.5).
- Fractional odds remain popular across classic racing and team sports markets in the UK and Ireland. Bettors who place wagers in these markets often rely on top-tier UK platforms, such as Unibet’s UK site, where fractional and decimal displays can be switched seamlessly.
3. American Odds (Moneyline Format)
American odds are based on a baseline of $100. They use positive (+) and negative (-) signs to distinguish favorites from underdogs.
- Negative odds (-): Indicate how much money you must wager to win $100 in net profit. (e.g., -140 means risking $140 to profit $100).
- Positive odds (+): Indicate how much net profit you earn on a $100 wager. (e.g., +150 means risking $100 to profit $150).
Calculating Implied Probability
To evaluate true value across bookmakers, convert odds into implied probability—the market’s assessment of how likely an outcome is to occur.
$$\text{Implied Probability (Decimal)} = \left( \frac{1}{\text{Decimal Odds}} \right) \times 100$$
If Bookmaker A offers odds of 2.10 on a match, the implied probability is:
$$\left(\frac{1}{2.10}\right) \times 100 = 47.62\%$$
If Bookmaker B offers odds of 2.25 on the same outcome, the implied probability drops to 44.44%. Lower implied probability for the same selection means a higher financial return for you if the bet wins.
Step-by-Step Guide: How to Compare Betting Odds Effectively
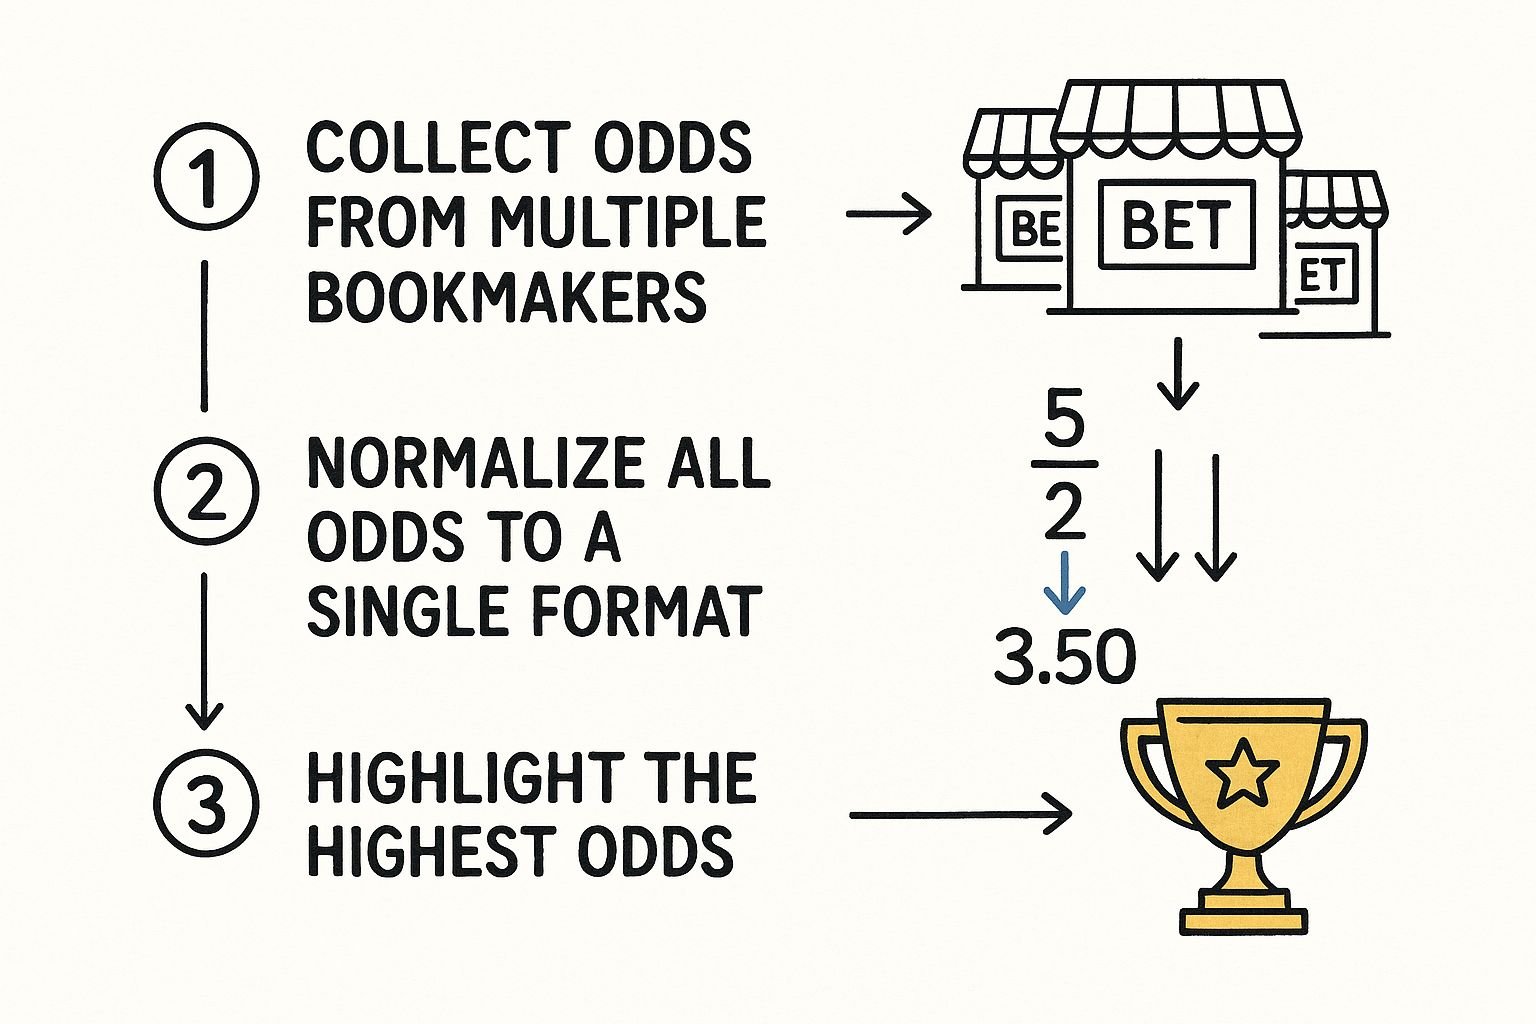
To build a consistent workflow, treat odds comparison as a structured routine rather than an afterthought. Follow this five-step strategy every time you prepare to place a bet.
┌─────────────────────────────────────────────────────────┐
│ 5-STEP ODDS COMPARISON │
├─────────────────────────────────────────────────────────┤
│ 1. Maintain accounts across multiple bookmakers │
│ 2. Pinpoint the exact event and market │
│ 3. Standardize all odds to Decimal format │
│ 4. Evaluate vigorish and alternative lines │
│ 5. Execute the bet at the highest available odds │
└─────────────────────────────────────────────────────────┘
Step 1: Open Accounts Across Multiple Bookmakers
You cannot take advantage of line differences if you only hold an account with a single sportsbook. To shop effectively, maintain funded accounts across at least three to five reputable bookmakers. Having active accounts with a varied selection of operators gives you immediate flexibility to grab a top price before the line moves.
For instance, international bettors who travel or bet across global markets frequently maintain accounts with well-established brands like Unibet’s main platform to access extensive international sporting coverage alongside regional options.
Step 2: Define Your Exact Wager First
Before opening comparison tools or bookmaker apps, determine your precise selection. Are you betting on a team to win outright, cover a -3.5 spread, or hit an Over/Under total of 2.5 goals? Having a clear goal prevents impulse betting while you browse odds matrix grids.
Step 3: Standardize Odds to a Single Format
If you are comparing sites across different regions, align all odds into one format. Decimal odds work best because they eliminate ambiguity. When you compare betting odds in decimal form, the largest number always represents the highest potential payout.
Step 4: Account for Line Differences in Spread & Handicap Markets
On point spreads, handicap markets, and total points/goals, bookmakers do not just adjust odds numbers; they also adjust the line itself.
For instance:
- Bookmaker X: Team A -3.5 (-110)
- Bookmaker Y: Team A -3.0 (-120)
Here, you must decide whether gaining a half-point of protection (-3.0 instead of -3.5) is worth paying extra juice (-120 vs -110). In football and basketball, key numbers (like 3 and 7 in American football) carry immense value. Comparing both the spread and the price associated with it is crucial.
Step 5: Execute Promptly
Odds are dynamic; they shift constantly based on news, team announcements, weather, and heavy betting volume. Once you identify the best market price, place your wager promptly before the line moves against you.
Key Factors That Cause Odds Differences Between Bookmakers
Why don’t all bookmakers offer the exact same odds for the same game? Several industry dynamics explain why odds diverge across sportsbooks.
WHY BOOKMAKER ODDS DIFFER
┌─────────────────────────────────────────────────────┐
│ 1. TARGET MARGINS / VIG │
│ Different operators target different profit % │
├─────────────────────────────────────────────────────┤
│ 2. RISK MANAGEMENT │
│ Bookmakers adjust lines to balance local liability│
├─────────────────────────────────────────────────────┤
│ 3. TIMING & MARKET LEADER DEPENDENCY │
│ Some books post early; others copy & lag behind │
├─────────────────────────────────────────────────────┤
│ 4. LOCAL MARKET BIAS │
│ Bettors in specific countries tilt public lines │
└─────────────────────────────────────────────────────┘
1. Differing Vigorish and Margin Philosophy
Not all bookmakers operate under the same business model. Some aim for high volume by charging lower margins (e.g., 2% to 3% vig), offering sharper, more competitive odds. Others target recreational bettors with higher margins (e.g., 5% to 8% vig), compensating with frequent promotions, loyalty programs, or enhanced parlays.
European sportsbooks operate in highly competitive environments where pricing transparency is paramount. Bettors targeting European football leagues, tennis, or cycling often monitor odds via established regional options like Unibet’s EU platform, where competitive market pricing on major European fixtures helps keep theoretical margins low.
2. Liability and Order Flow Differences
Bookmakers adjust odds to manage their own risk exposure. If a bookmaker receives an unusually large volume of money on Team A, it will shorten the odds on Team A and lengthen the odds on Team B to entice money onto the opposite side. A rival sportsbook with balanced action on the same game will have no need to adjust its line, creating a noticeable price discrepancy between the two operators.
3. Regional and Fan Base Biases
Local sentiment heavily influences bookmaker odds. In Australia, for example, massive domestic wagering volume on Aussie Rules (AFL), Rugby League (NRL), and horse racing forces bookmakers to react swiftly to local betting trends. Domestic operators catering specifically to this market—such as Unibet Australia—tailor their odds and promotional markets to reflect regional sporting preferences and local betting flow.
When a public favorite from a specific region plays, local bookmakers often shorten the price on that team because they know their domestic user base will bet on them regardless of price. Shopping globally or across diverse sportsbooks allows you to take advantage of these regional biases.
4. Market Speed and Reaction Times
When key news breaks—such as a star player getting injured during warmups—some sportsbooks update their odds within seconds using automated trading feeds. Other sportsbooks rely on manual trading desk adjustments or lag behind by several minutes. If you act quickly when news breaks, you can capture stale lines before secondary sportsbooks align with the rest of the market.
Tools and Strategies for Line Shopping
While manual line shopping (opening five apps and checking each line individually) works well for occasional single bets, serious sports bettors utilize dedicated tools and systematic strategies to speed up the process.
1. Odds Comparison Websites and Aggregators
Odds comparison sites aggregate live data from dozens of bookmakers into a single side-by-side matrix. These platforms update in real time or near-real time, highlighting the highest available price for every selection in green.
- Benefits: Saves massive amounts of time; instantly reveals market outliers.
- Features to look for: Look for aggregators that display line movement history (steamers and drifters), historical odds charts, and customizable bet baskets for accumulator wagers.
SAMPLE ODDS MATRIX GRID
┌───────────────────────┬────────────┬────────────┬────────────┐
│ Selection: Chelsea │ Bookmaker 1│ Bookmaker 2│ Bookmaker 3│
├───────────────────────┼────────────┼────────────┼────────────┤
│ Match Result (1X2) │ 2.10 │ 2.25 ★ │ 2.15 │
│ Draw │ 3.40 │ 3.30 │ 3.50 ★ │
│ Both Teams to Score │ 1.80 │ 1.87 ★ │ 1.83 │
└───────────────────────┴────────────┴────────────┴────────────┘
(★ indicates best available market price)
2. Using Betting Exchanges as a Benchmark
Betting exchanges operate differently from traditional bookmakers. Instead of setting odds themselves, exchanges allow bettors to buy (back) and sell (lay) outcomes against each other. Because exchanges feature a peer-to-peer structure, their odds often reflect true market probability more accurately than traditional sportsbooks (after adjusting for exchange commission).
Comparing traditional sportsbook odds against current exchange prices gives you a clear indicator of whether a bookmaker’s line offers genuine value or carries an inflated margin.
3. Tracking “Steam Moves” and Market Trends
When professional betting syndicates place heavy wagers on a selection, the odds move rapidly across all sportsbooks. This phenomenon is known as a steam move. By tracking odds changes across multiple operators using comparison tools, you can spot early price drops at sharp sportsbooks and quickly place wagers at slower sportsbooks before their lines adjust.
Common Pitfalls to Avoid When Comparing Bookmakers
While line shopping is a highly effective strategy, bettors often make mistakes that reduce its benefits. Here are key pitfalls to avoid:
1. Ignoring Deposit Fees and Withdrawal Terms
A sportsbook might offer slightly better odds on paper, but if it charges high withdrawal fees, steep currency conversion costs, or restrictive transaction conditions, those hidden expenses can eat into your profit margin. Always factor overall platform usability and banking terms into your evaluation.
2. Neglecting Promotional Value and Enhanced Odds
Sometimes a bookmaker with slightly lower standard odds offers enhanced odds promotions, profit boosts, or money-back specials on major events. Always evaluate the net value of a wager including any active bonuses, free bet tokens, or payout boosts before making your final selection.
3. Over-Fanning Out Your Bankroll
Opening accounts with ten different sportsbooks is useless if your capital is spread so thin that you cannot afford to place a standard bet size on any single platform. Keep your bankroll consolidated across three to four core bookmakers, or use rapid payment methods that allow fast transfers between accounts when an attractive price appears.
4. Failing to Track Your Wagers
If you bet across multiple platforms, tracking your performance manually or via an automated tracking spreadsheet is essential. Record the date, event, market, odds taken, bookmaker used, and outcome. Reviewing this data over time will confirm how much extra profit line shopping generates for your bankroll.
Summary Checklist for Effective Line Shopping
Before placing your next wager, run through this quick checklist to ensure you are maximizing your return:
- Check at least 3 sportsbooks: Never settle for the first price you see.
- Convert to Decimal odds: Compare payouts on a unified scale.
- Check the spread AND the juice: Evaluate whether a point difference justifies the price difference.
- Use odds comparison tools: Speed up your search during fast-moving market conditions.
- Lock in the price promptly: Take advantage of favorable odds before lines adjust.
Final Thoughts
Learning how to compare betting odds systematically is one of the few true edges available to sports bettors. It requires no complex mathematical modeling, insider knowledge, or guesswork. By opening accounts with several reputable sportsbooks, using odds comparison tools, and consistently taking the highest available price on every selection, you drastically lower the house edge and give yourself the best possible chance of long-term profitability.
Make line shopping an automatic part of your betting routine today. The extra returns you lock in on every winning wager will accumulate significantly over time.