
Understanding whether your weight falls within a healthy range is one of the most important steps toward maintaining long-term health. A BMI chart (Body Mass Index chart) provides a quick and practical way to assess whether your body weight is appropriate for your height. It is widely used by healthcare professionals, including organizations like the NHS and global health authorities, to identify potential health risks linked to being underweight, overweight, or obese.
In today’s data-driven health environment, people are not just looking for explanations—they want clear answers. This updated guide goes beyond basic definitions by providing a structured BMI chart, height-based weight ranges, and deeper insights into how BMI should be interpreted in real life. Whether you are checking your BMI for the first time or tracking your progress, this guide is designed to give you accurate, useful, and actionable information.
BMI Chart for Adults (Height and Weight Reference Table)
A BMI chart allows you to quickly estimate whether your weight falls within a healthy range based on your height. Instead of calculating manually, many users prefer a visual reference that shows weight ranges corresponding to BMI categories. Below is a simplified BMI chart for adults, combining commonly accepted health ranges used by medical institutions.
| Height | Healthy Weight Range | Overweight Range | Obese Range |
| 5’4″ (163 cm) | 49–66 kg | 67–79 kg | 80+ kg |
| 5’7″ (170 cm) | 54–72 kg | 73–87 kg | 88+ kg |
| 5’10” (178 cm) | 59–79 kg | 80–95 kg | 96+ kg |
| 6’0″ (183 cm) | 62–83 kg | 84–100 kg | 101+ kg |
This table is especially helpful for users searching for a “BMI chart kg and lbs” or a quick reference without needing calculations. It aligns with global BMI classification standards and offers an immediate understanding of where your weight stands. However, it is important to remember that these values are general guidelines and should be interpreted alongside other health indicators.
Beyond convenience, BMI charts are valuable because they simplify complex health metrics into an easy-to-understand format. This is why they are commonly used in clinics, gyms, and public health campaigns. By simply locating your height and comparing your weight, you can identify your category and take appropriate steps if necessary.
What BMI Means and How It Is Calculated
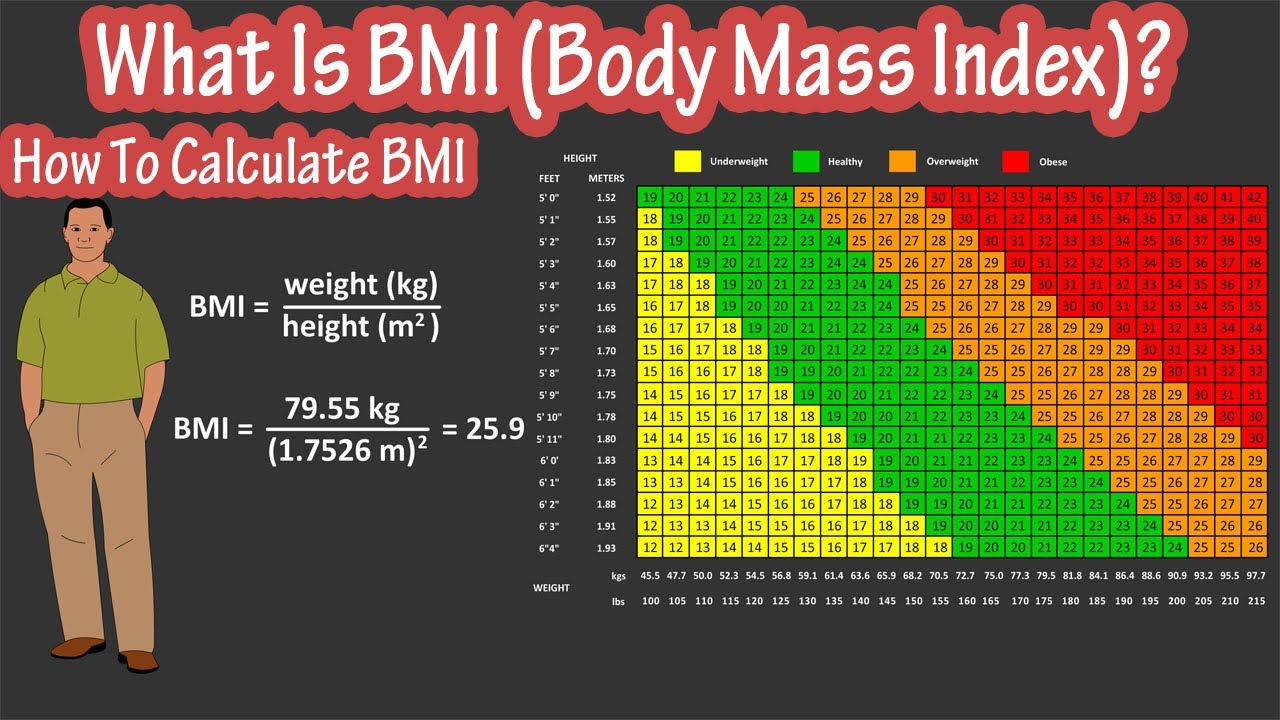
Body Mass Index (BMI) is a numerical value derived from your weight and height. It is calculated using the formula:
BMI=weight(kg)height(m)2BMI = \frac{weight (kg)}{height (m)^2}BMI=height(m)2weight(kg)
This formula provides a standardized way to categorize individuals into weight groups. For example, a person weighing 70 kg with a height of 1.75 meters would have a BMI of approximately 22.9, which falls within the healthy weight category. This simplicity makes BMI one of the most widely used screening tools in both clinical and non-clinical settings.
Despite its simplicity, BMI carries significant value in identifying potential health risks. It is often used as a first step before further medical evaluation. While it does not measure body fat directly, it correlates strongly with more detailed assessments in large populations. That is why institutions like the NHS and CDC continue to rely on BMI as a baseline indicator of health.
BMI Categories Explained (Adult Classification)
BMI results are grouped into categories that indicate potential health risks. These classifications help individuals and healthcare providers understand whether weight may be contributing to conditions such as heart disease, diabetes, or hypertension. The standard BMI categories for adults are as follows:
- Underweight: Below 18.5
- Healthy weight: 18.5 – 24.9
- Overweight: 25.0 – 29.9
- Obese Class I: 30.0 – 34.9
- Obese Class II: 35.0 – 39.9
- Obese Class III: 40.0 and above
These categories are essential for interpreting BMI results correctly. For instance, someone with a BMI of 28 is considered overweight and may benefit from lifestyle changes, while a BMI above 30 indicates a higher level of health risk that may require professional intervention.
It is also important to note that BMI categories are designed for adults aged 20 and above. For younger individuals, BMI is interpreted differently using age- and gender-specific growth charts. Understanding these distinctions ensures that BMI is used appropriately and accurately across different populations.
BMI Chart by Age, Gender, and Ethnicity
While BMI provides a general guideline, it does not apply equally to everyone. Factors such as age, gender, and ethnicity can influence how BMI should be interpreted. For example, older adults may have lower muscle mass, which can result in a “normal” BMI despite reduced strength or higher fat levels. Similarly, men and women may store fat differently, affecting health outcomes even at the same BMI.
Ethnicity is another important factor often overlooked. Research shows that individuals from South Asian, African, and Middle Eastern backgrounds may face higher health risks at lower BMI levels. This is why UK-specific tools, such as the NHS BMI calculator, provide adjusted guidance for certain populations. These nuances highlight the importance of not relying solely on BMI but using it as part of a broader health assessment.
BMI for Children and Teenagers
BMI is calculated differently for children and teenagers aged 2 to 19. Instead of fixed categories, BMI is interpreted using percentile charts that compare a child’s measurements to others of the same age and gender. This approach accounts for growth patterns and developmental changes, making it more accurate for younger populations.
For example, a child may be considered underweight, healthy, overweight, or obese based on their percentile ranking rather than a fixed BMI number. This system ensures that natural growth variations are taken into account. Parents and caregivers should use specialized BMI calculators designed for children to obtain accurate results and consult healthcare professionals if there are concerns about growth or weight.
Limitations of the BMI Chart and Better Alternatives
Although BMI is a useful screening tool, it has limitations. One of the main drawbacks is that it does not differentiate between muscle and fat. This means that athletes or individuals with high muscle mass may be classified as overweight or obese despite having a healthy body composition. Conversely, someone with low muscle mass may fall within a healthy BMI range while still having higher body fat.
To gain a more accurate understanding of health, BMI should be combined with other measurements. These include waist-to-hip ratio, body fat percentage, and metabolic health markers such as blood pressure and cholesterol levels. In some cases, alternative indices like the Ponderal Index (PI) may provide better insights, particularly for individuals who are unusually tall or short.
How to Use BMI Results for Better Health Decisions
BMI should be viewed as a starting point rather than a final diagnosis. If your BMI falls outside the healthy range, it is an opportunity to assess your lifestyle and make improvements. Small, consistent changes in diet, physical activity, and sleep can significantly impact overall health and help bring BMI into a healthier range over time.
For those with a BMI in the overweight or obese category, even modest weight loss can lead to meaningful health benefits. Losing just 5–10% of body weight can improve cardiovascular health, reduce the risk of diabetes, and enhance overall well-being. Regular monitoring using a reliable BMI calculator can help track progress and keep you motivated on your health journey.
Why the BMI Chart Still Matters in 2026
Despite ongoing debates about its limitations, the BMI chart remains one of the most practical and accessible health tools available. It is simple, quick to use, and supported by decades of research. In a world where people are increasingly focused on health and wellness, BMI continues to provide a valuable reference point for understanding weight-related risks.
Modern health tools have evolved to include more personalized insights, but BMI still plays a central role in initial health assessments. When used alongside other indicators, it becomes even more powerful. By understanding its strengths and limitations, individuals can use the BMI chart effectively to make informed decisions about their health and lifestyle.
Frequently Asked Questions (FAQs)
What is a BMI chart used for?
A BMI chart is used to determine whether your weight falls within a healthy range based on your height. It helps identify potential health risks associated with being underweight, overweight, or obese.
Is BMI accurate for everyone?
BMI is a useful screening tool but not perfectly accurate for all individuals. Factors such as muscle mass, age, and ethnicity can influence results, so it should be used alongside other health indicators.
What is a healthy BMI range?
A healthy BMI range for adults is between 18.5 and 24.9. This range is associated with lower risks of weight-related health conditions.
How often should I check my BMI?
It is generally recommended to check your BMI every few months, especially if you are actively trying to manage your weight or improve your health.
Can BMI be used for children?
Yes, but it is calculated differently using age- and gender-specific percentile charts. Standard adult BMI categories do not apply to children and teenagers.
You may also read: WhatsApp Web: The Complete Guide to Using WhatsApp on Your Desktop in 2025